The Basics of Moving Averages (MAs)
A Moving Average (MA) stands as a widely employed technical analysis indicator, effectively sifting out the “noise” generated by short-term price fluctuations. It serves as a trend-tracking tool rooted in historical prices.
The two predominant and extensively utilized MAs in trading are the Simple Moving Average (SMA), which offers insights over a predetermined span, and the Exponential Moving Average (EMA), prioritizing current prices. MAs have conventionally served in discerning trend direction and identifying support and resistance zones.
Notably, MAs are recognized for their tendency to lag behind price movements. The extent of lag increases with longer MA periods, thus justifying their classification as lagging indicators. While they may not provide immediate insights into present price action, they offer valuable information about the overall market direction and trends.
A notable feature of these indicators is their adaptability to various timeframes. Irrespective of the chosen timeframe—whether it’s 1 hour, 4 hours, or even 1 minute—the 50MA indicator automatically adjusts by considering the most recent 50 hours for a 1-hour chart or the latest 50 minutes for a 1-minute chart.
An intriguing observation is that larger MAs on shorter timescales can also serve as reference points for smaller MAs on longer timeframes. For instance, the 200EMA on a 1-hour timeframe correlates to the 50EMA on a 4-hour timeframe. While the calculations might involve a bit of mental effort, this trick proves handy for conceptualizing EMAs across a range of timeframes.
To delve deeper into the practical applications of moving averages, let’s start by exploring SMAs. As the name implies, SMAs are derived through a straightforward calculation that does not incorporate weighted data or price points. They are computed using the following formula:
- SMA = ( Sum ( Price, n ) ) / n
- Where: n = Time Period
This brief calculation helps determine the average price for the respective number of days. The initial data point for a 10-day MA would be calculated using the closing price of the first 10 days prior to the closure of the current trading day.
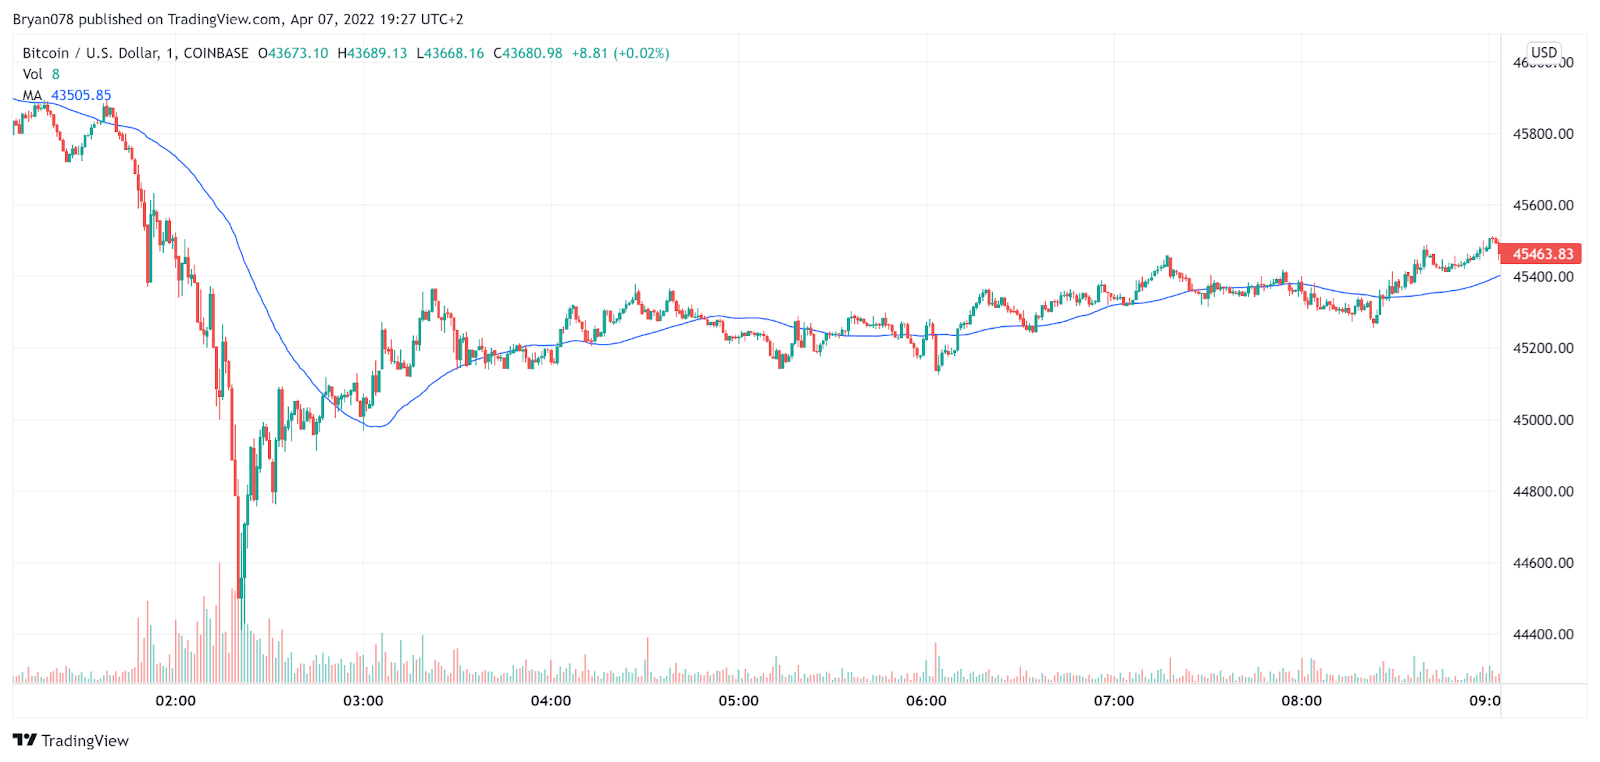
The 1min 50MA indicator automatically takes the 50 most recent minutes (or the 50 most recent hours if you’re looking at the hourly chart). Timeframes are critical in determining how traders capitalize on this indicator. They also explain how the graph is generated over a period of time since price movement throughout that time interval causes it to become a ‘moving’ average. As such, the SMA is updated every time an increment of the selected time frame passes, as can be seen in the graph above.
What is an Exponential Moving Average (EMA)?
The exponential moving average (EMA) stands as a pivotal technical chart indicator delineating the price evolution of investments like stocks, commodities, or cryptocurrencies. EMA, a weighted moving average (WMA), assigns heightened significance to the latest price data. While akin to the simple moving average (SMA) in analyzing price trends, EMA’s heightened price sensitivity results in comparatively reduced lag.
With each passage of the chosen time frame increment, the EMA undergoes recalibration via the subsequent formula:
EMAToday=(ValueToday∗(1+DaysSmoothing))+EMAYesterday∗(1−(1+DaysSmoothing))
Therefore, as is done with the SMA, the first measurement would be removed and replaced by the next and newest measurement (hence why it moves along with the selected time frame).
What are the main differences between their use cases?
In brief, the EMA is supposed to ameliorate the idea of an SMA by assigning more weight to recent price data, which is often seen to be more important than older data for traders. However, let’s go over some of the main similarities and differences:
- Similarities
- SMAs and EMAs both aid traders in determining the market’s broad direction.
- When calculating the average, both use the same number of data points. The 1h 50EMA and 50SMA both use the previous 50H as data points.
- SMAs and EMAs can be utilised as support and resistance markers.
- Differences
- Weighted MAs are called EMAs while non-weighted or homogenous weights per data points are called SMAs.
- Because EMAs use more recent data, they are often more price sensitive.
- Due to its sensitivity, it has a shorter lag-time than SMAs for starting and exiting trades based on this gauge than its simple equivalent.
How do you trade using EMAs or SMAs in trading?
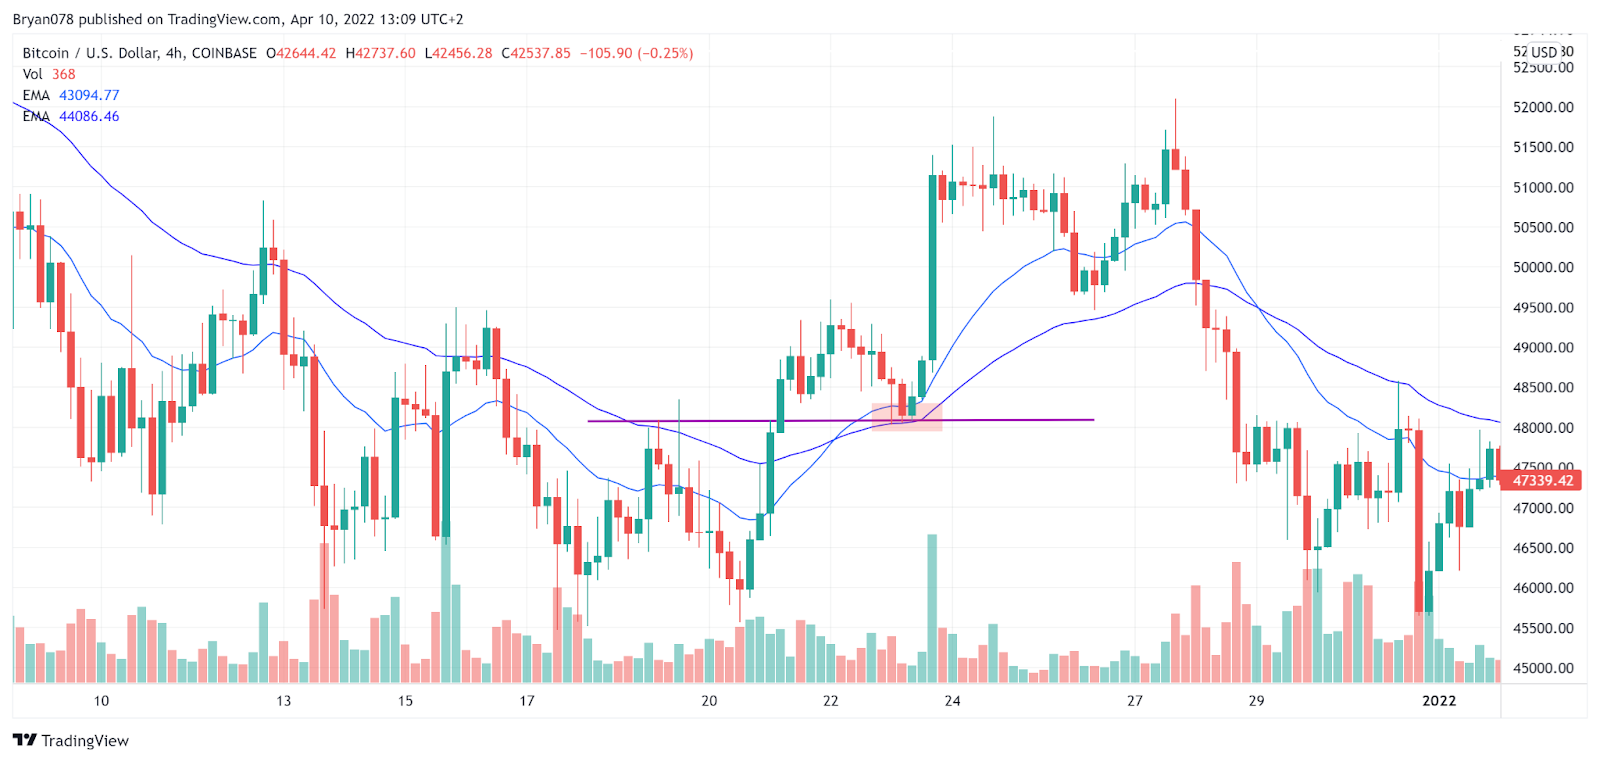
Support & Resistance
While MAs are sufficient, they can also act as support and resistance. See the article on onXRP about support and resistance:
Support
- The Purple line represents the resistance (zone/line)
- The continuous Blue and Dark Blue lines represent the 20EMA and 50EMA respectively.
Here, the chart signals a good opportunity for traders because the 20EMA is above the 50EMA, the price is bouncing off the 50EMA on a large time frame (4h) AND it is bouncing off a previous resistance (the red box). Such opportunities can be fruitful when capitalized. However, this is by no means financial advice.
Resistance
- The straight Purple line represents the resistance (zone/line)
- The continuous Blue and Dark Blue lines represent the 20EMA and 50EMA respectively.
In this case, the chart signals a good opportunity because the 20EMA is below the 50ema, the price cannot break through the EMAs after falling AND it is rejecting previous resistance levels in the red boxes. Again, capitalizing on such opportunities can be fruitful, but this is at one’s own discretion.

Both the SMA and EMA can be used as an indicator to open a trade, either a short or long trade.
Mean Reversion
Mean reversion stands as another strategic approach employed by major players like market makers. EMAs and SMAs, being real-time reflections of buy and sell orders, often witness prices abruptly descending or surging through them, either breaking through support or surpassing resistance levels. However, in such scenarios, there’s a proclivity for the price to ‘revert’ back towards the EMAs, once it moves significantly away from these indicators. Traders, particularly scalpers, capitalize on this rebound’s momentum using leverage to harness swift price ‘reversion.’ While potentially highly profitable, mastering this strategy demands years of experience. It’s important to underline that this isn’t financial advice and must be exercised at one’s own discretion.
Determining the Trend
Because it comprises the prices from the previous 200 days, a 200-day MA will have a far greater lag than a 20-day MA. Why? The average is calculated using ten times more points than the original 20 data points.
When it comes to trading, which MA to utilise is dependent on the size of the selected timeframe. Larger MAs are better for long-term investors, whereas lower MAs are better for short-term traders.
Although this is the popular view, both investors and traders use the 50-day and 200-day MAs to determine the market’s overall trend. This is because MAs can provide key trading indicators. A rising MA suggests that prices are growing, while a falling MA suggests the opposite. A bullish crossover occurs when a small MA passes over a large MA, confirming upward momentum (see chart). Conversely, when a smaller MA crosses below a larger MA, a bearish crossover is confirmed which conveys a shift toward a more bearish trend (see chart).
The 5 and 13EMA are also two vital moving averages used to determine short-term market direction. The price (candles) is in a solid upward tendency if it is above these EMAs and pointing upward. Contrarily, the price is deemed to be in a downward trend if it falls below the EMAs and the 5EMA crosses the 13EMA in a downward fashion. If the price ends up being rejected anew, the trend has reversed.
- Orange: 50sma
- Blue: 150sma
There is an uptrend if the sma50 is above the sma150 and a downtrend if the 50MA is below the 150SMA. It can be seen clearly in the above chart. At the arrows, when a crossover occurs, the trend shifts.